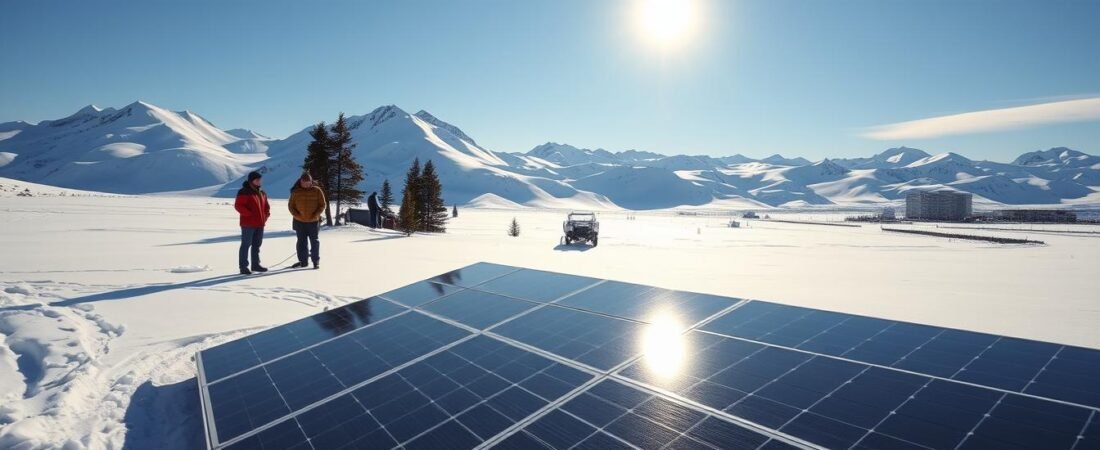
Planning a home energy upgrade starts with clear numbers and practical steps. As of 2026, the average rate sits at $3.14 per watt, and a typical 7.2 kW system runs about $15,826 after the 30% federal tax credit.
That math matters when you compare local installer quotes, system size, and net metering rules. Homeowners should weigh equipment quality, professional installation, and long-term savings over 25 years.
This guide will help you understand how local prices compare to the national average of $3.03 per watt. You’ll learn how incentives, federal tax credits, and reliable installers shape the true investment for your property.
Understanding the True Cost of Solar Panels in Alaska
Expect the sticker number for a residential energy system to include more than equipment. Shipping to remote areas, winter-ready mounts, and extra labor raise the total price. Permitting and inspection fees add a predictable layer to any bid.
How much electricity your household uses matters. Higher consumption means a larger system and more panels to offset utility bills. That drives both upfront cost and long-term savings.
Panel type affects performance and price. Monocrystalline units give better efficiency per square foot, while polycrystalline can lower the initial purchase price. Durable equipment that lasts 25 years is key for homeowners who want real returns.
Trustworthy companies provide transparent quotes that list permits, warranties, installer margins, and expected output. Compare those line items to see if the projected savings beat other investments or tie you to lengthy service contracts.
Current Market Pricing and System Size Impacts
A simple metric — dollars per watt — levels the playing field when you shop for systems.
Price per watt explained:
Price per Watt Explained
The price per watt lets homeowners compare quotes from different installers. It shows the true value beyond headline totals. A lower per-watt rate often signals bulk purchasing or efficient equipment choices.
System size and bulk pricing:
System Size and Bulk Pricing
Larger systems usually drop the per-watt figure. For example, a 4 kW setup averages $3.87 per watt while a 10 kW system can be $2.89 per watt. That gap rewards buyers who install more capacity up front.
“Ask every company for a per-watt breakdown so you can compare quotes accurately.”
- Why it matters: Fixed design and permitting fees make add-ons more costly later.
- Tip: Pick a system size based on annual electricity use and future savings goals.
- Ask installers for equipment, warranty, and installation line items.
| System Size | Avg Price per Watt | Typical Total Price |
|---|---|---|
| 4 kW | $3.87 | $15,480 |
| 7.2 kW | $3.14 | $22,608 |
| 10 kW | $2.89 | $28,900 |
Key Factors Influencing Your Total Installation Investment
Roof condition and electrical upgrades often drive more of the bill than panel counts. A steep or complex roof increases labor and mounting needs. That raises the average cost for a complete system.
Old breaker boxes or limited service may require an electrical upgrade. That work adds time and adds to the final price of a proper solar installation.
Sun exposure matters. South-facing, unshaded roofs need fewer panels to meet the same electricity goal. That lowers per watt expense and boosts long-term savings.
Local wages, permit fees, and market demand change the price you see on quotes. Premium equipment such as high-efficiency inverters or battery storage will raise the upfront investment but can improve returns over years.
- Check the roof for repairs before panel installation to avoid future maintenance costs.
- Get multiple quotes so equipment quality matches the price you pay.
- Factor in system size and local utility rules when comparing offers.
| Factor | How it Affects Price | What Homeowners Should Do |
|---|---|---|
| Roof condition | Higher labor and mounting costs for complex or damaged roofs | Repair or reinforce before installation |
| Electrical upgrades | Extra permits and wiring increase total installation | Obtain an electrical inspection early |
| Equipment choice | Premium gear and batteries raise upfront investment | Balance efficiency gains with warranty and lifespan |
| Local market | Labor rates and permit fees shift final quote totals | Compare local installers and request itemized bids |
Navigating Federal Tax Credits and Local Incentives
Federal incentives can shrink your upfront bill far more than many homeowners expect. A major reason is the federal solar investment tax credit, which covers 30% of an installed system’s eligible price.
The credit is claimed on your federal tax return in the year after installation. That timing matters when you project payback and annual savings.
The Federal Solar Investment Tax Credit
The tax credit lets homeowners deduct 30% of the installed system from federal taxes. This applies to equipment, installation labor, and required wiring.
Many people call it an Alaska solar tax credit, but it is a federal program. Local utility rebates or municipal incentives can stack with the credit and lower your effective price per watt.
- Claim timing: Use the credit on the next tax year after installation.
- Stacking: Combine federal credit with local rebates to reduce out-of-pocket costs.
- Advice: Consult a tax professional to confirm eligibility and required forms.
“Maximizing tax credits and local incentives can cut the payback period by several years.”
Comparing Cash Purchases Versus Solar Loans
Deciding between paying cash or financing shapes both your monthly budget and long-term returns.
Paying cash eliminates interest and often delivers the highest lifetime savings. You also claim the 30% tax credit against your federal return and reduce the net price at once.
Taking a loan lets homeowners add a system with little or no upfront capital. Monthly payments can be lower than current electricity bills, giving immediate relief.
But loans add interest. That reduces total savings over years. Watch for variable rates, balloon payments, and early repayment penalties.
“A well-sized system maximizes returns whether you pay cash or finance.”
| Option | Upfront Expense | Long-term Savings |
|---|---|---|
| Cash | High | Highest (no interest) |
| Fixed-rate loan | Low to none | Good (interest lowers net) |
| Variable-rate loan | Low to none | Riskier (rates may rise) |
Before signing, compare quotes, read terms, and confirm system size to protect your investment.
Evaluating Solar Leases and Power Purchase Agreements
A lease or PPA can lower initial outlays, but it also hands control to the provider for decades. These contracts change who owns the equipment and who claims the benefits from output and incentives.
Understanding the terms helps you compare offers. A lease means you rent the panels and pay a regular fee. The provider stays responsible for maintenance and repairs.
Understanding Lease Terms
Key items to check:
- Length of the agreement and early termination rules.
- Who pays for repairs, insurance, and roof access.
- Escalator clauses that raise payments over the years.
Risks of Power Purchase Agreements
With a PPA you buy the electricity the system makes at an agreed per kilowatt-hour price. That can be lower than utility rates at first.
Major trade-offs: You do not own the system, so you cannot claim the 30% tax credit yourself. Contracts can last 20 years or more, so end-of-term handling is crucial.
“Have an expert review any lease or PPA contract for hidden fees and long-term risks.”
| Agreement Type | Ownership | Main Benefit | Main Risk |
|---|---|---|---|
| Lease | Provider | Low or no upfront price | Limited savings and no tax credit |
| PPA | Provider | Pay only for produced electricity | Long-term price escalation, no ownership |
| Purchase | Homeowner | Full incentives and higher lifetime savings | Higher upfront installation expense |
Bottom line: For many homeowners, owning the system offers better long-term savings and control over energy and utility bills. Always compare numbers, read the fine print, and get a professional review before signing.
Technical Realities of Solar Energy in the Last Frontier
Designing for extremes means balancing months of surplus with months of near-zero generation. This seasonal swing changes how a home system is sized and used.
Sunlight Patterns and Polar Nights
Midnight Sun yields massive summer output, while polar night brings long stretches with almost no production.
That makes net metering rules and summer export rates critical to financial viability.
Efficiency in Cold Climates
Modules actually run more efficiently at low temperatures, often boosting output per watt during cool, clear days.
But snow cover and heavy cloud reduce annual yields, so tilt, racking, and snow-shedding design matter.
Net Metering Policies
Robust net metering lets homeowners bank excess summer generation to offset winter electricity use.
Without it, payback periods lengthen and the practical value of panels drops.
“Work with an installer who knows local net metering and designs systems for both long summer days and winter darkness.”
- Plan for snow management and durable mounts.
- Match system size to seasonal patterns, not only daily use.
- Confirm net metering and local incentives before signing.
Why Quality Matters More Than the Lowest Quote
Choosing the cheapest bid often hides weak warranties and inferior materials that fail under harsh weather. A low up-front price can lead to repeated repairs and lower lifetime savings.
A reliable installer will charge a fair price that keeps them available to support your system for 25 years. Look for clear warranties, stable companies, and documented workmanship standards.
Labor is a small fraction of the total investment; durable equipment and skilled installation preserve roof integrity and steady electricity output. Poor workmanship can cause leaks or electrical hazards that raise long-term costs.
“Always compare multiple quotes and ask for itemized equipment, labor, and warranty details.”
- Prioritize installers who show local experience and maintenance plans.
- Beware of ridiculously low bids that skip proper mounts or wiring.
- Choose firms that stand behind performance guarantees and service visits.
Bottom line: Paying a bit more up front often secures better performance, higher savings, and a stronger investment for your home.
Long-Term Savings and Return on Investment
Start by comparing your net investment after incentives to the annual value of power you no longer buy from the grid.
Calculating Your Payback Period
Simple method: subtract the tax credit and other rebates from the upfront price, then divide that net figure by yearly avoided utility bills.
Example: a typical 5.1 kW solar system reaches payback in about 12.6 years in many parts of the state. Over 25 years, cumulative savings often far exceed initial expenses.
Why it matters: energy inflation makes this an attractive hedge. Utility rates tend to rise while on-site generation preserves predictable monthly outlays.
- Net present value improves with higher system size and local incentives.
- Generating your own power lowers grid reliance and shields homeowners from future rate spikes.
- A well-kept system can boost resale value and long-term returns.
| Metric | Value | Notes |
|---|---|---|
| Payback | ≈12.6 years | 5.1 kW example |
| Horizon | 25 years | Cumulative avoided utility costs |
| Boost | Federal credit + local incentives | Improves ROI and lowers net price |
For local averages and installer quotes, check a trusted resource such as Alaska system pricing guide.
“Treat the system as a 25-year investment, not a short-term expense.”
The Future of Renewable Energy in Alaska
Large utility-scale projects now prove that northern regions can host meaningful renewable development.
The Houston Solar Farm — with 14,000 panels and an 8.5-megawatt capacity — marks a clear milestone. Its scale shows that high-latitude projects can produce reliable clean power during bright months.
By Q2 2023, the state had reached about 19 MW of installed generation. That steady growth points to broader adoption of both utility and residential solar systems.
Why this matters: tighter Cook Inlet gas supplies raise questions about future fuel availability. New renewables offer diversity and local resilience.
Utilities are responding: many seek competitive offers for clean power, and homeowner interest is rising as prices and tax incentives improve payback.
| Project | Capacity (MW) | Panels | Year |
|---|---|---|---|
| Houston Farm | 8.5 | 14,000 | 2023 |
| State Total | 19.0 | ~31,000 | Q2 2023 |
| Residential Growth | — | Varied | Ongoing |
“Expanding renewables strengthens energy security and gives homeowners more control over power choices.”
- Large projects prove feasibility for northern climates.
- Home systems empower residents and reduce reliance on gas.
- Continued tech gains and price drops will speed adoption.
Conclusion
An informed purchase balances system size, equipment quality, and available tax incentives.
This guide shows how a solar panel installation can deliver long-term savings and greater energy independence. Compare quotes, check warranties, and pick trusted professionals for durable results.
When evaluating panel installation options, focus on expected output, warranty terms, and local export rules. For many homeowners, installing solar pays back over years when matched to usage and net metering policies.
Watch the price and the fine print of any installation offer. Claim available tax credit benefits and factor those into your net payback calculations.
Talk to a vetted installer or multiple installers for a site-specific estimate. A short consultation will clarify options and give a clear path to moving forward with confidence.